MSA's Value to You
MSA has a thirty-year track record of calling long-term trends before the crowd notices. The crowd waits until the "trend is their friend," sometimes missing the big trends entirely. Our method allows us to spot them early.
Natural Gas Breakout in September 2020
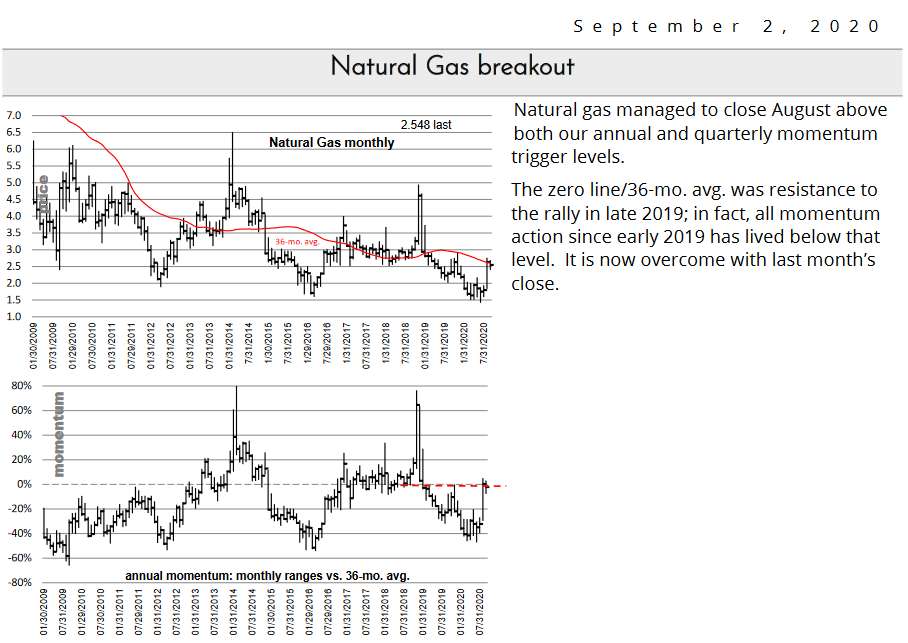
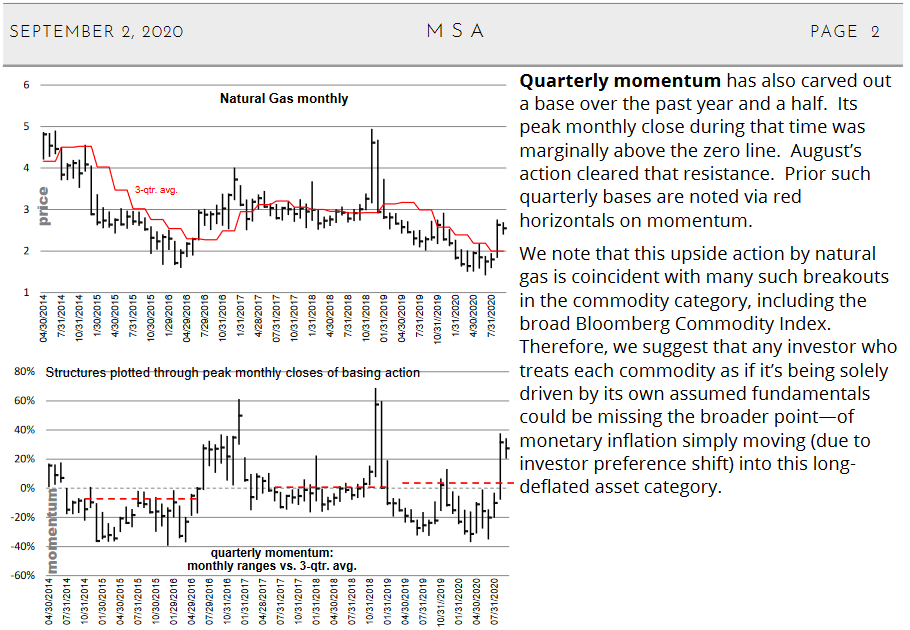
Was anyone telling you about breakouts in natural gas, or crude oil, XOP, OIH, fertilizer companies, etc. in 2020, before they rocketed higher?
We were alerting our subscribers of these breakout markets in summer 2020...
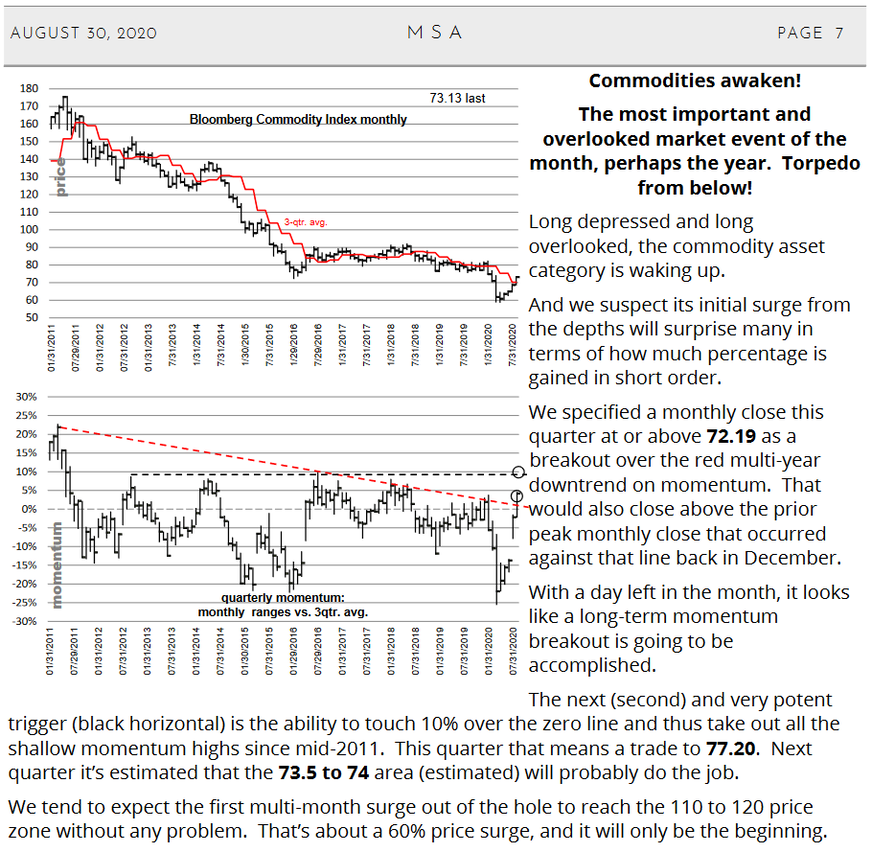
Commodity Breakout in August 2020
Thirty-year track record of calling major tops and bottoms. Do you want to sell the top with the precision of a Federal Reserve president?
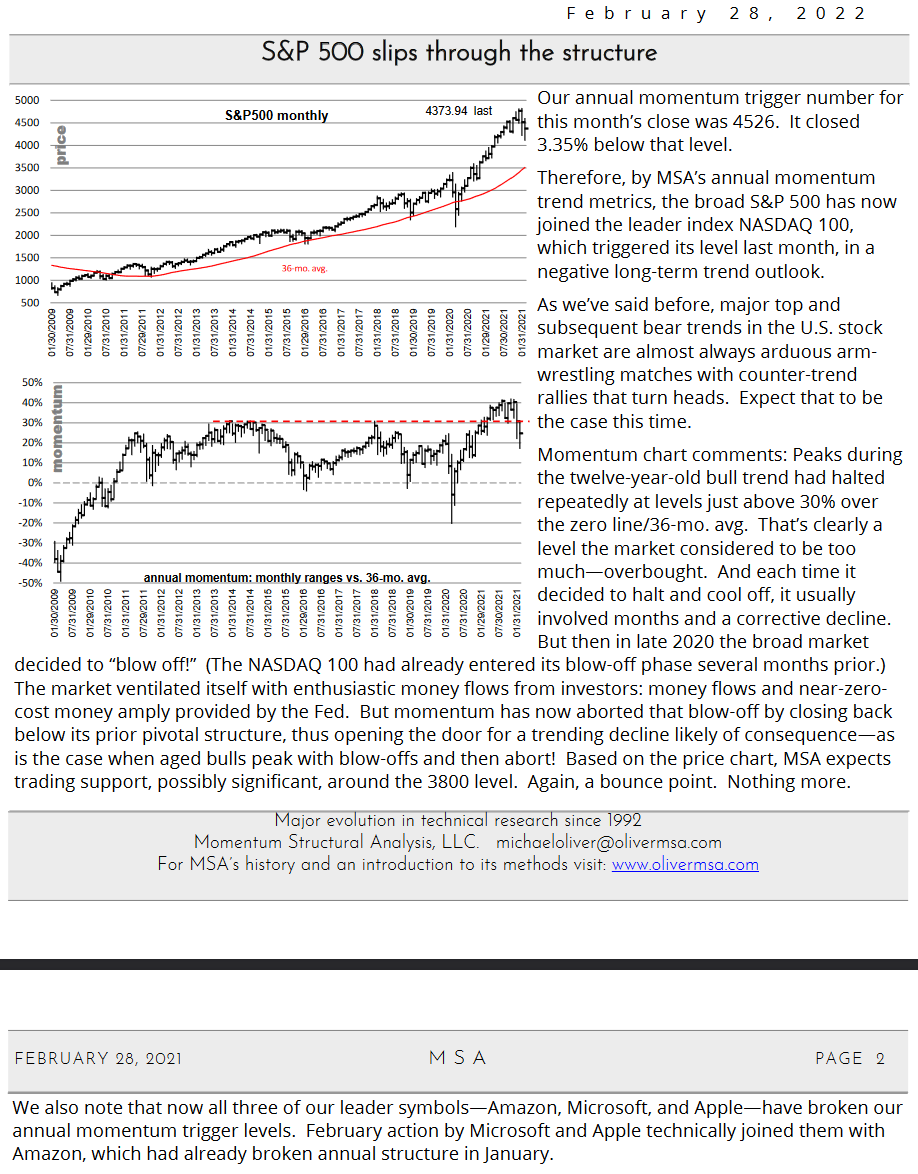
Stock Market Top in January, February 2022
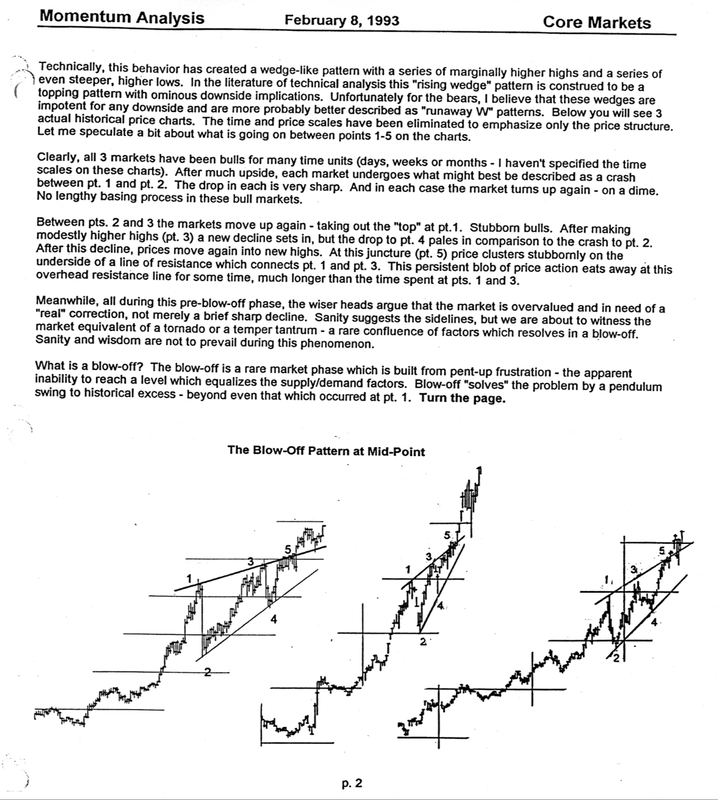
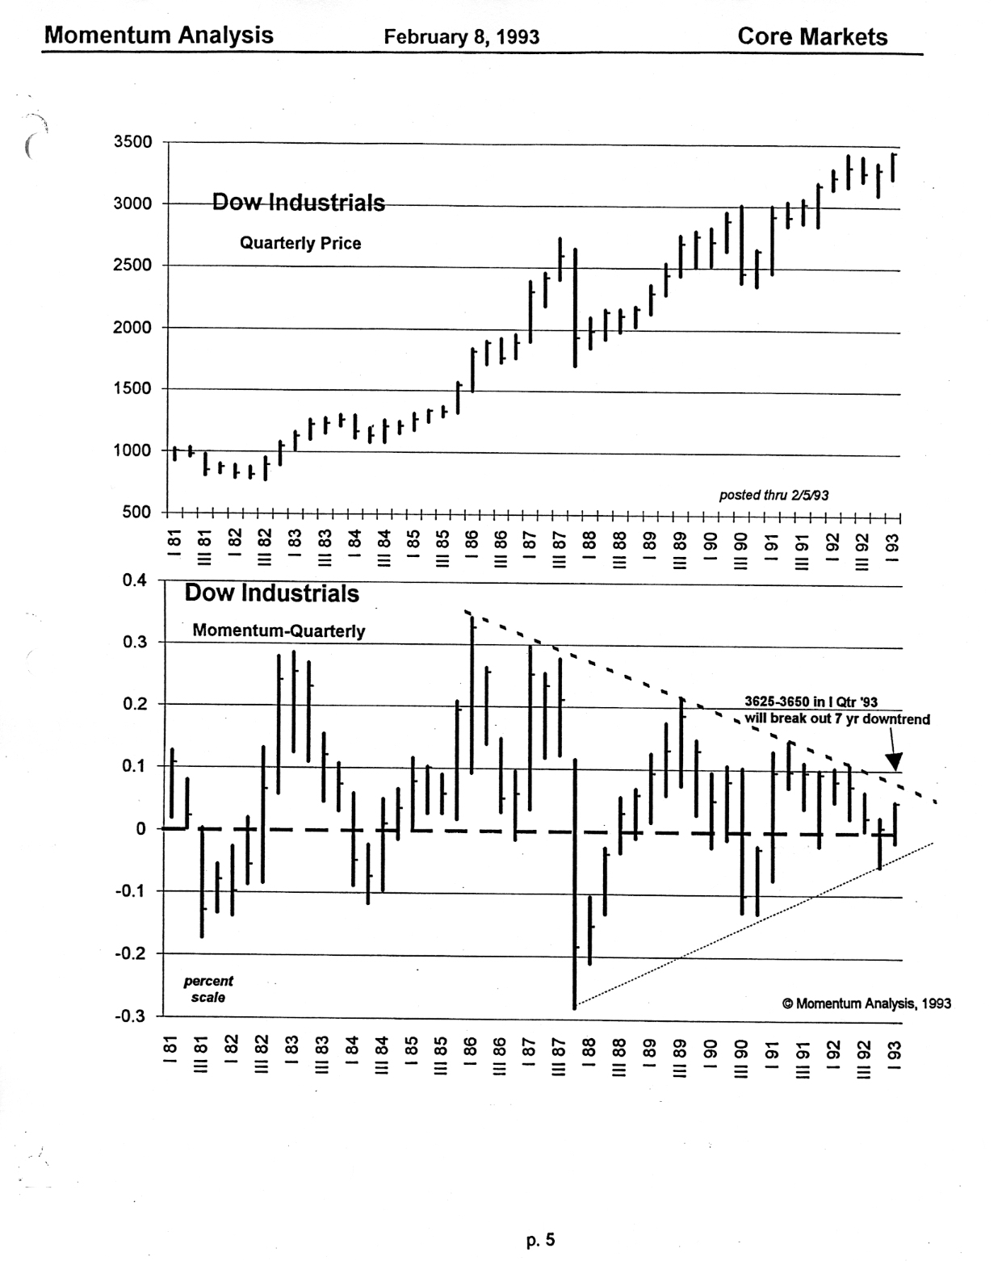
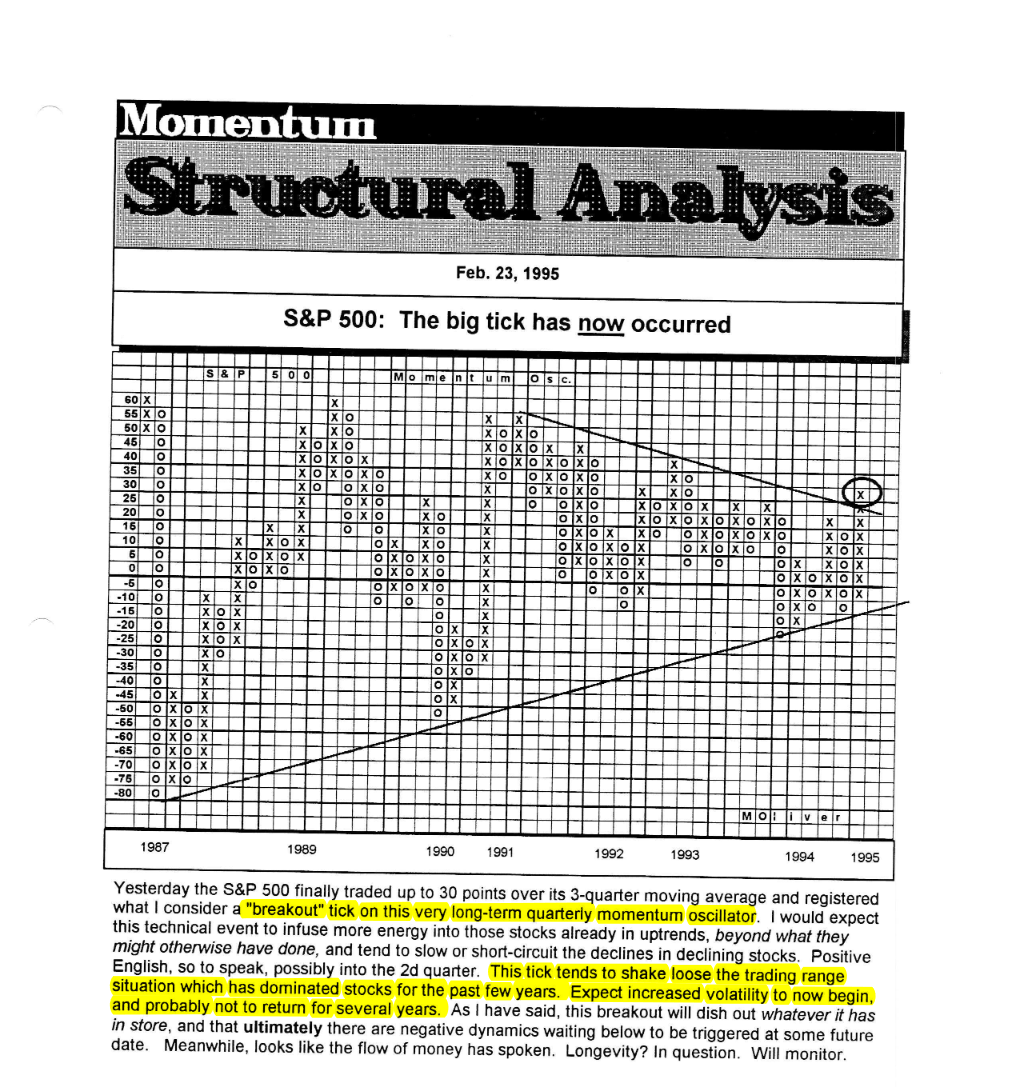
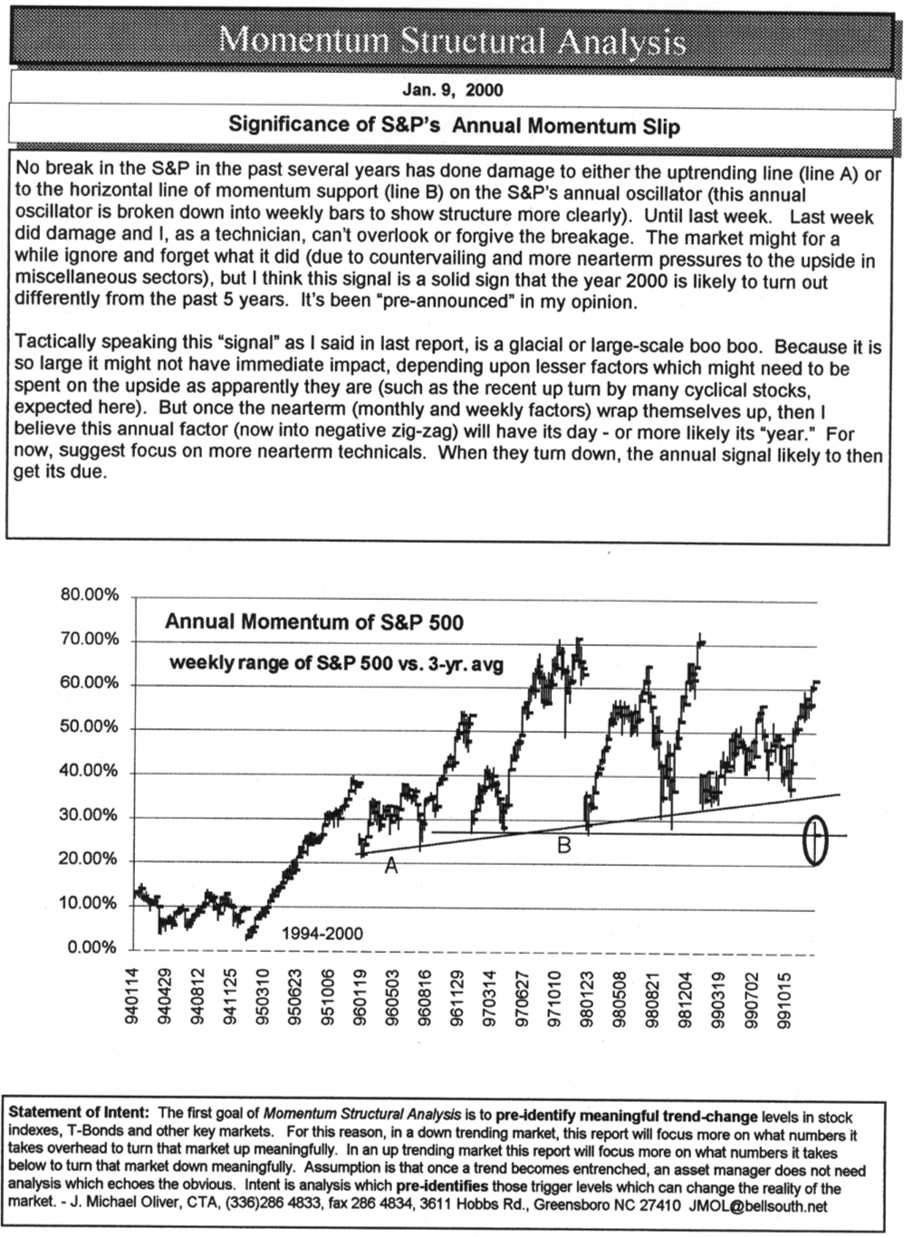
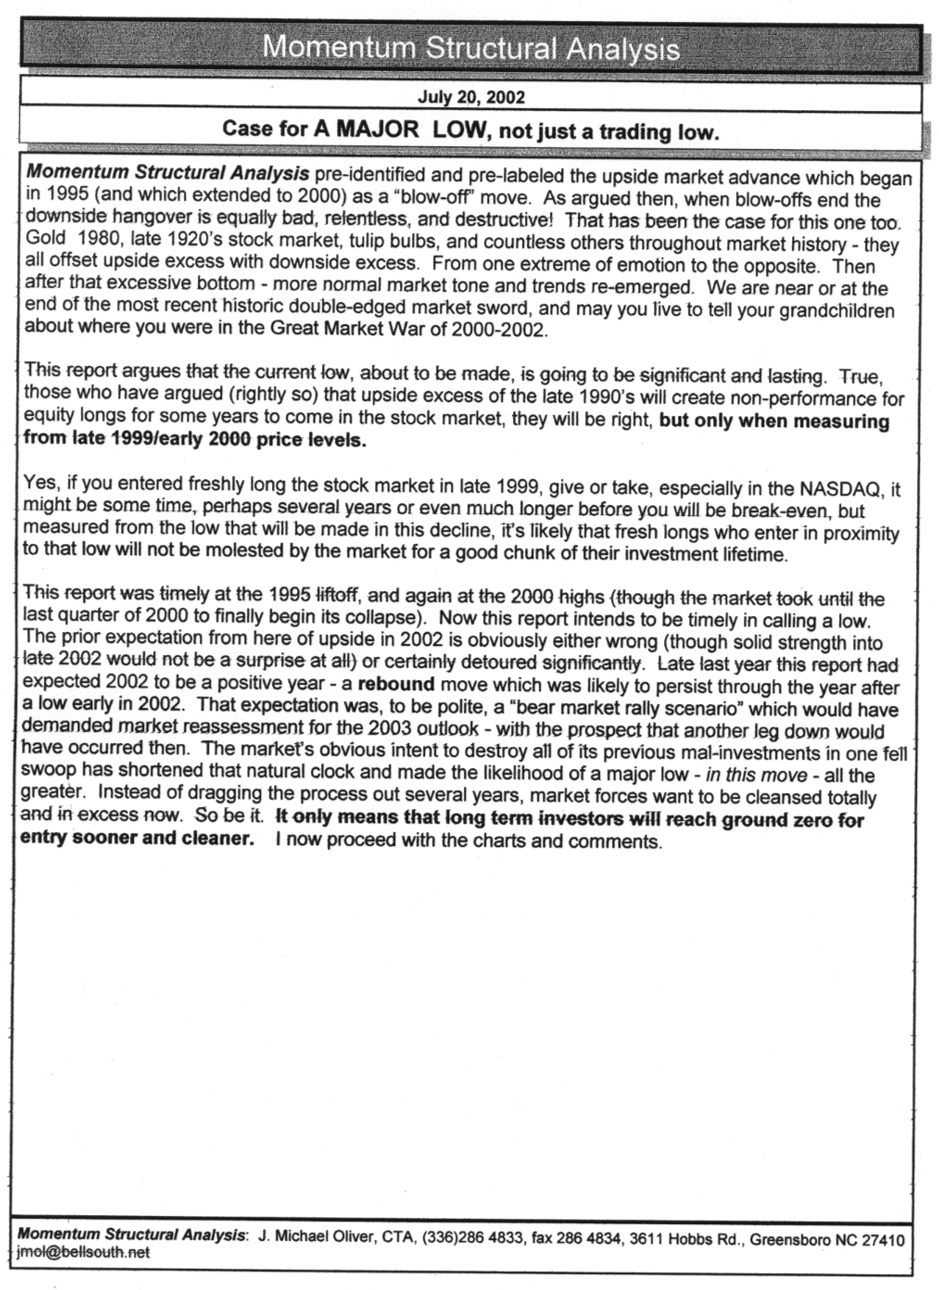
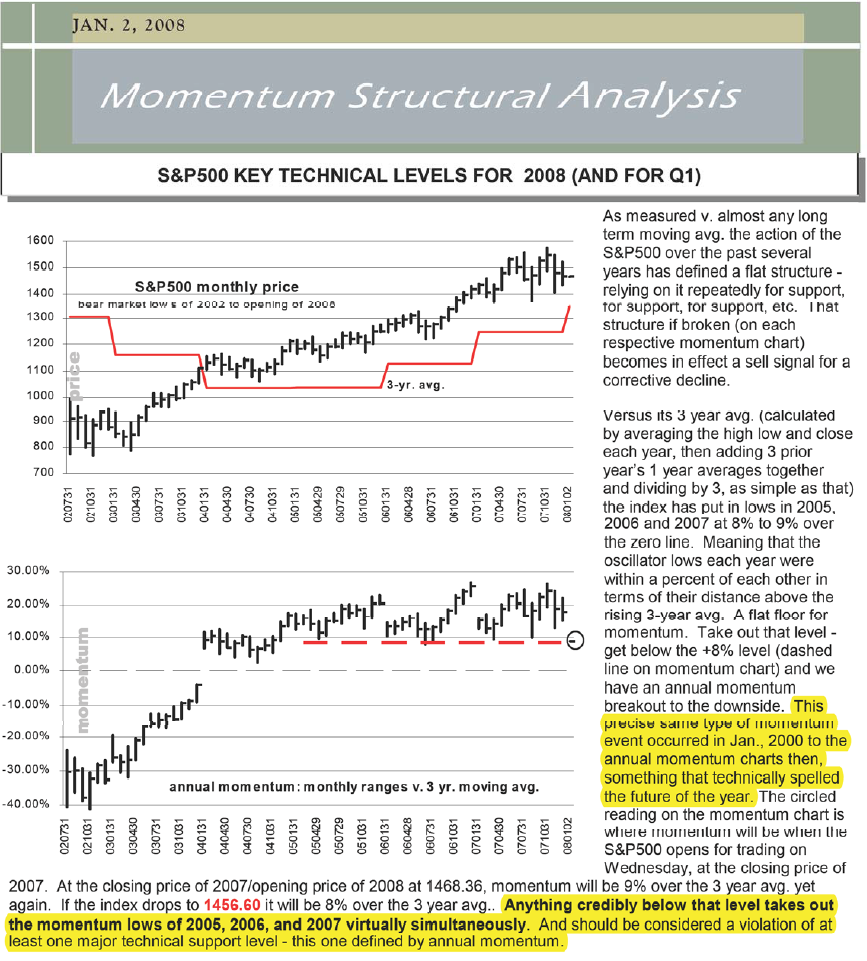
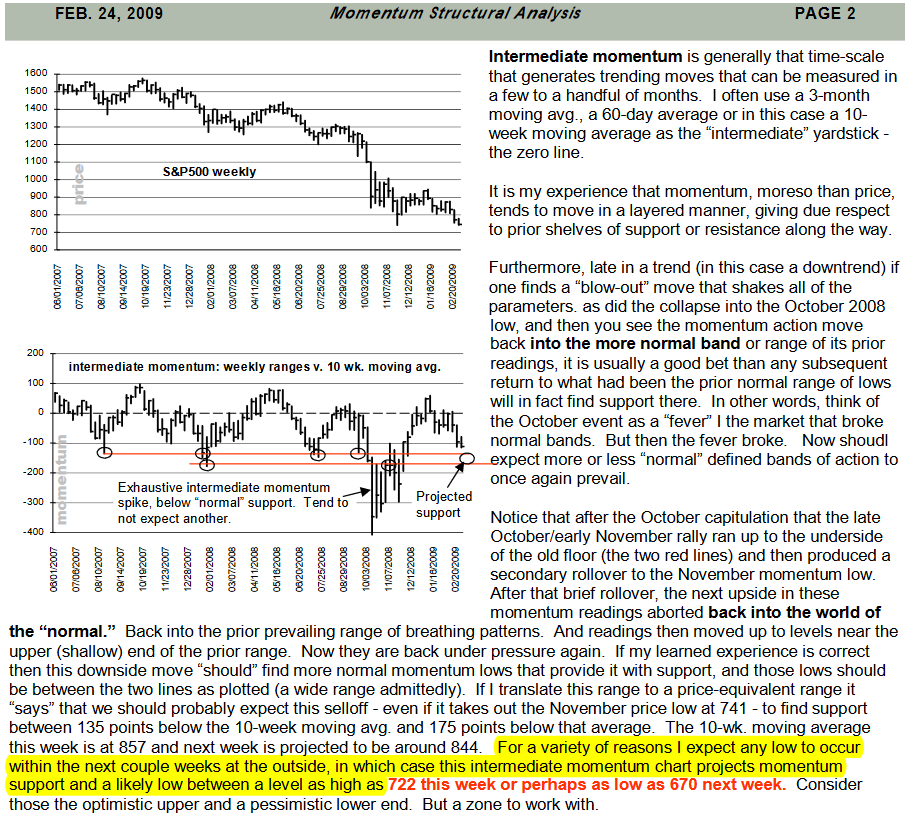
Examples of Prior Major Tops and Bottoms
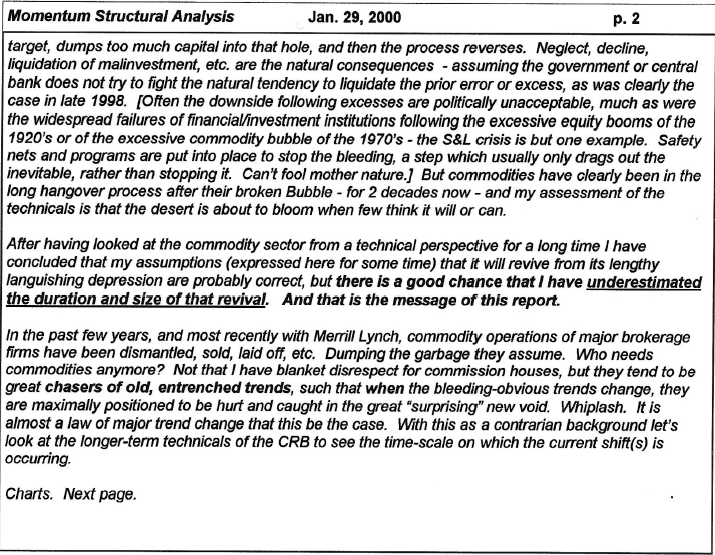
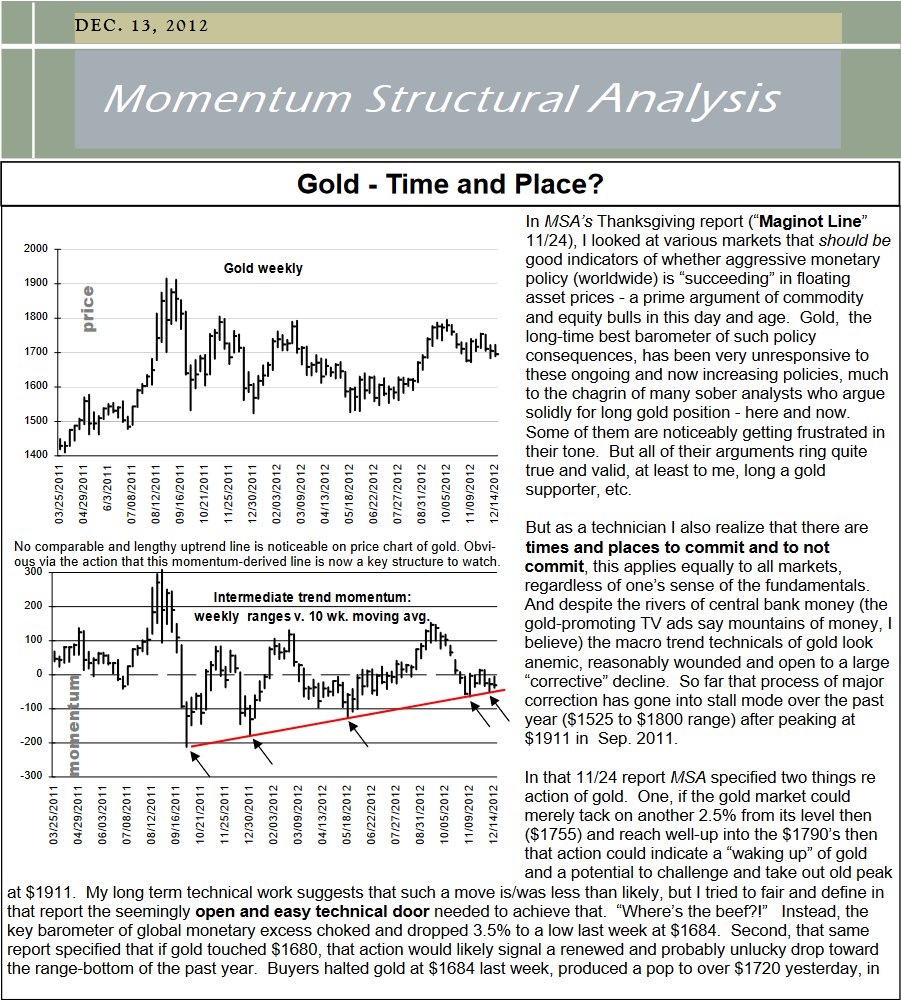
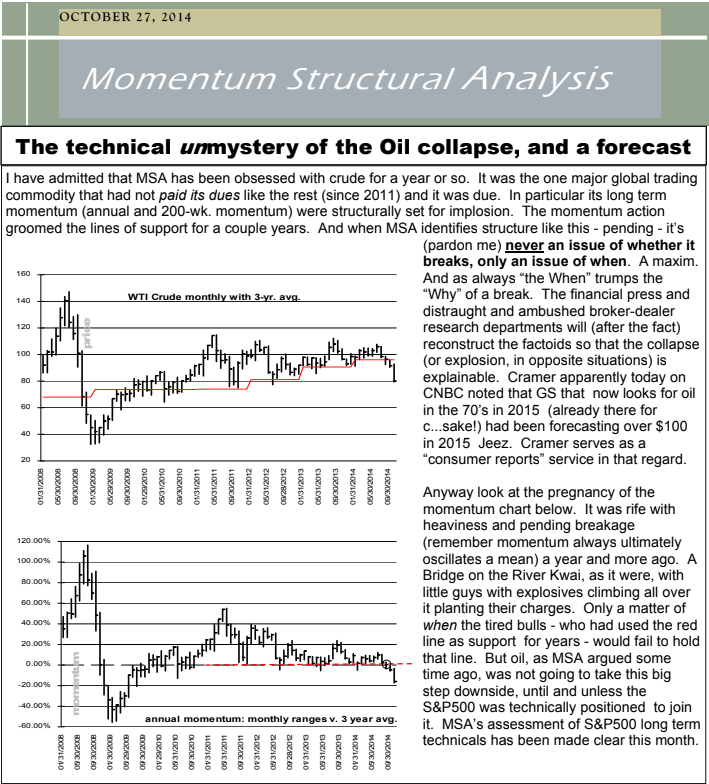
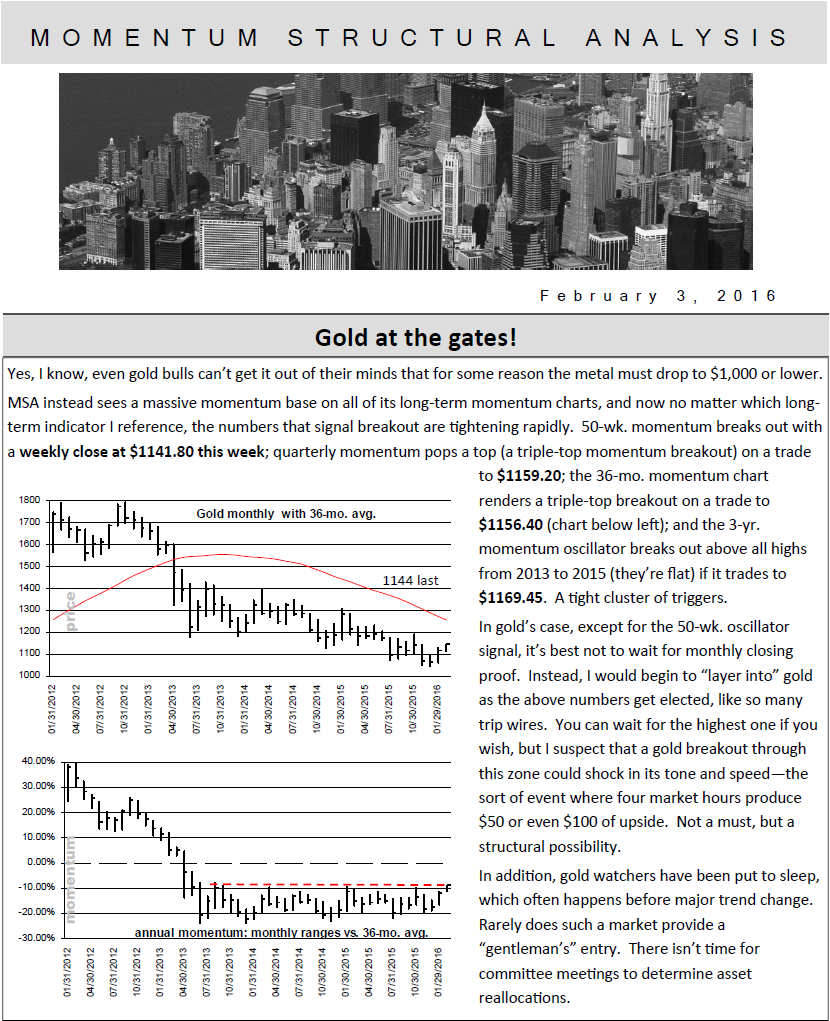
(S&P 1993, 1995, 2000, 2002, 2008, 2009) (Commodities 2000, Gold 2012, Oil 2014, Gold 2016)
(S&P 1993, 1995, 2000, 2002, 2008, 2009) (Commodities 2000, Gold 2012, Oil 2014, Gold 2016)

Our method uses momentum to time tops and bottoms. Momentum will be building up or breaking down usually long before the price charts (what the crowd sees) finally acknowledge that a trend shift has occurred. Momentum helps to keep you in a trend and avoid false moves. We wouldn’t call ourselves contrarians, but it can often look that way because we’ll foresee a new trend before the crowd.
We are focused primarily on long-term trends, and as such are by definition not day-traders and for the most part avoid short-term swing-trading. We’ll warn you if we think there’s a good chance of a significant counter-trend move. We catch many of those as well but we aren’t focused on every daily zig-zag. No method is perfect: we admit when we’re uncertain or when we’ve made a wrong call.
Subscribers receive our reports by email, and we also make them available on our website. Our full service covers stocks, bonds, commodities (including precious metals), Forex, and crypto (Bitcoin and Ethereum). Our Gold, Silver, Mining service covers the metals and miners exclusively. See our subscription page for more details on pricing.
A Short and Humorous "Educational Short" about MSA